pyestimate.sin_param_estimate
- pyestimate.sin_param_estimate(x, freq=None, use_fft=False, nfft=4096, brute_Ns=1000, detrend_type='constant')
Estimate the parameters of a sinusoid (amplitude, frequency and phase). The sinusoid model is \(s[n] = A \cos(2 \pi f n + \phi)\).
In the presence of white gaussian noise, the estimator implemented is the maximum likelihood estimator if use_fft is set to False.
- Parameters:
- xarray_like
A 1-D input sequence of real numbers.
- freqfloat, optional
Digital frequency of the input sinusoid (freq = F/Fs if F is the analog frequency and Fs is the sampling frequency). If freq is None or is not given, the frequency is estimated.
- use_fft: bool, optional
If True, use a periodogram to estimate frequency. This should be used if the digital frequency is known to be in [2/N, 1/2-2/N], with N = len(x) otherwise, set to False.
- nfft: int, optional
Length of the FFT used if use_fft is True.
- brute_Ns: int, optional
Number of points to be used for the brute force search used if use_fft is False. Increase if frequency resolution is too coarse.
- detrend_type: {‘linear’, ‘constant’}, optional
Specifies how to detrend the input sequence. It is passed as the type argument to the scipy.signal.detrend function. Default to constant.
- Returns:
- A: float
Estimated amplitude of the sinusoid (> 0).
- f: float
Estimated digital frequency of the sinusoid (or input frequency if freq was given as input parameter), in ]0, 0.5[.
- phi: float
Estimated phase of the sinusoid, in [-pi, pi].
Notes
If use_fft is set to False, the estimator is the maximum likelihood estimator (MLE) for a sinusoid in white gaussian noise. If use_fft is set to True, the estimator is close to MLE (if the digital frequency is in [2/N, 1/2-2/N]) and is faster to compute.
References
[1]Kay, S. M. (1997). Fundamentals of Statistical Signal Processing: Estimation Theory. Prentice Hall.
Examples
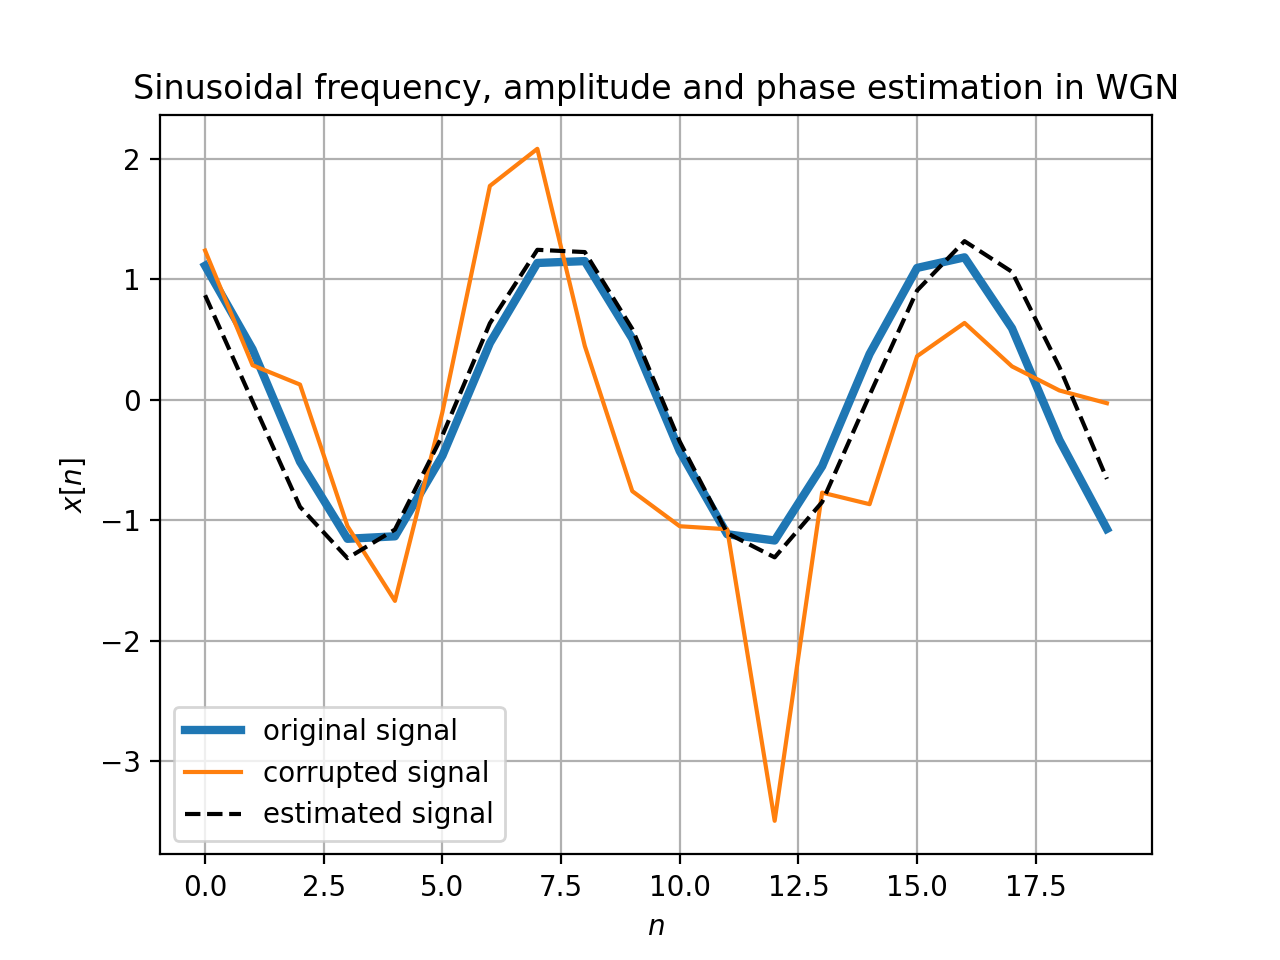
Generate a noisy sinusoid for which we want to estimate amplitude, frequency and phase
>>> from pyestimate.estimators import sin_param_estimate
>>> import numpy as np
>>> import matplotlib.pyplot as plt
>>> N = 20 # number of samples
>>> f = 0.123456 # frequency to be estimated
>>> A = 1.23456 # amplitude to be estimated
>>> phi = np.pi/7 # phase to be estimated
>>> sigma = 1 # standard deviation of WGN
>>> n = np.arange(N)
>>> s = A * np.cos(2*np.pi*f*n+phi) # original signal
>>> w = np.random.default_rng(seed=0).normal(scale=sigma, size=N) # white gaussian noise
>>> x = s+w # input signal for estimation: sine + noise
Estimate sinusoid parameters
>>> A_hat, f_hat, phi_hat = sin_param_estimate(x) # parameters estimation
Reconstruct original signal from estimated parameters
>>> s_hat = A_hat * np.cos(2*np.pi*f_hat*n+phi_hat) # estimated signal
Plot the original signal, the input signal corrupted with noise and the reconstructed signal
>>> plt.plot(n, s, linewidth=3.0, label='original signal')
>>> plt.plot(n, x, label='corrupted signal')
>>> plt.plot(n, s_hat, 'k--', label='estimated signal')
>>> plt.xlabel('$n$')
>>> plt.ylabel('$x[n]$')
>>> plt.title('Sinusoidal frequency, amplitude and phase estimation in WGN')
>>> plt.legend()
>>> plt.grid()
>>> plt.show()
(
Source code,png,hires.png,pdf)