pyestimate.sin2d_param_estimate
- pyestimate.sin2d_param_estimate(x, freq=None, use_fft=False, nfft=[1024, 1024], brute_Ns=100)
Estimate the parameters of a 2D sinusoid (amplitude, frequencies and phase). The 2D sinusoid model is \(s[n,m] = A \cos(2 \pi (f_n n + f_m m) + \phi)\).
In the presence of white gaussian noise, the estimator implemented is the maximum likelihood estimator if use_fft is set to False.
- Parameters:
- xarray_like
A 2-D input sequence of real numbers.
- freqsequence of 2 floats, optional
Digital frequencies of the input 2D sinusoid (freq[i] = F[i]/Fs if F[i] is the ith analog frequency and Fs is the sampling frequency). If freq is None or is not given, the frequency is estimated.
- use_fft: bool, optional
If True, use a periodogram to estimate frequency. This is faster, but might be less accurate for frequencies close to 0 or 0.5.
- nfft: sequence of 2 ints, optional
Length of the FFT used along each axis, if use_fft is True.
- brute_Ns: int, optional
Number of points to be used for the brute force search used if use_fft is False. Increase if frequency resolution is too coarse.
- Returns:
- A: float
Estimated amplitude of the sinusoid (> 0).
- f: list of 2 floats
Estimated digital frequencies of the sinusoid (or input frequencies if freq was given as input parameter), in ]0, 0.5[. The first frequency is the one corresponding to the row indexing.
- phi: float
Estimated phase of the sinusoid, in [-pi, pi].
Notes
If use_fft is set to False, the estimator is the maximum likelihood estimator (MLE) for a sinusoid in white gaussian noise. If use_fft is set to True, the estimator is close to MLE and is faster to compute.
Examples
>>> from pyestimate import sin2d_param_estimate
>>> import numpy as np
>>> import matplotlib.pyplot as plt
Define a 2D sinusoidal signal, corrupted by white gaussian noise
>>> N = 20
>>> M = 80
>>> fn0 = 0.089
>>> fm0 = 0.05
>>> A = 1.23454
>>> phi = 0.5789
>>> n, m = np.meshgrid(np.arange(N), np.arange(M), indexing='ij')
>>> sigma2 = 0.2
>>> x = A * np.cos(2*np.pi*(fn0*n+fm0*m) + phi) + np.random.default_rng(seed=0).normal(scale=np.sqrt(sigma2), size=(N,M)) # Noisy 2D sinusoid
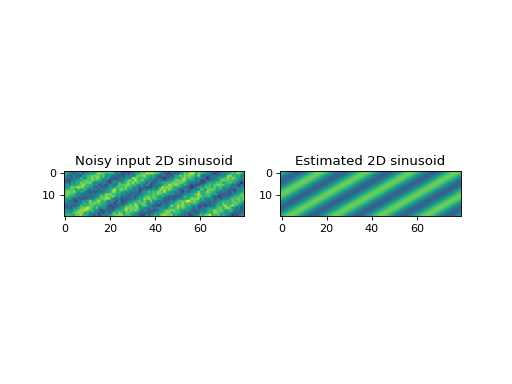
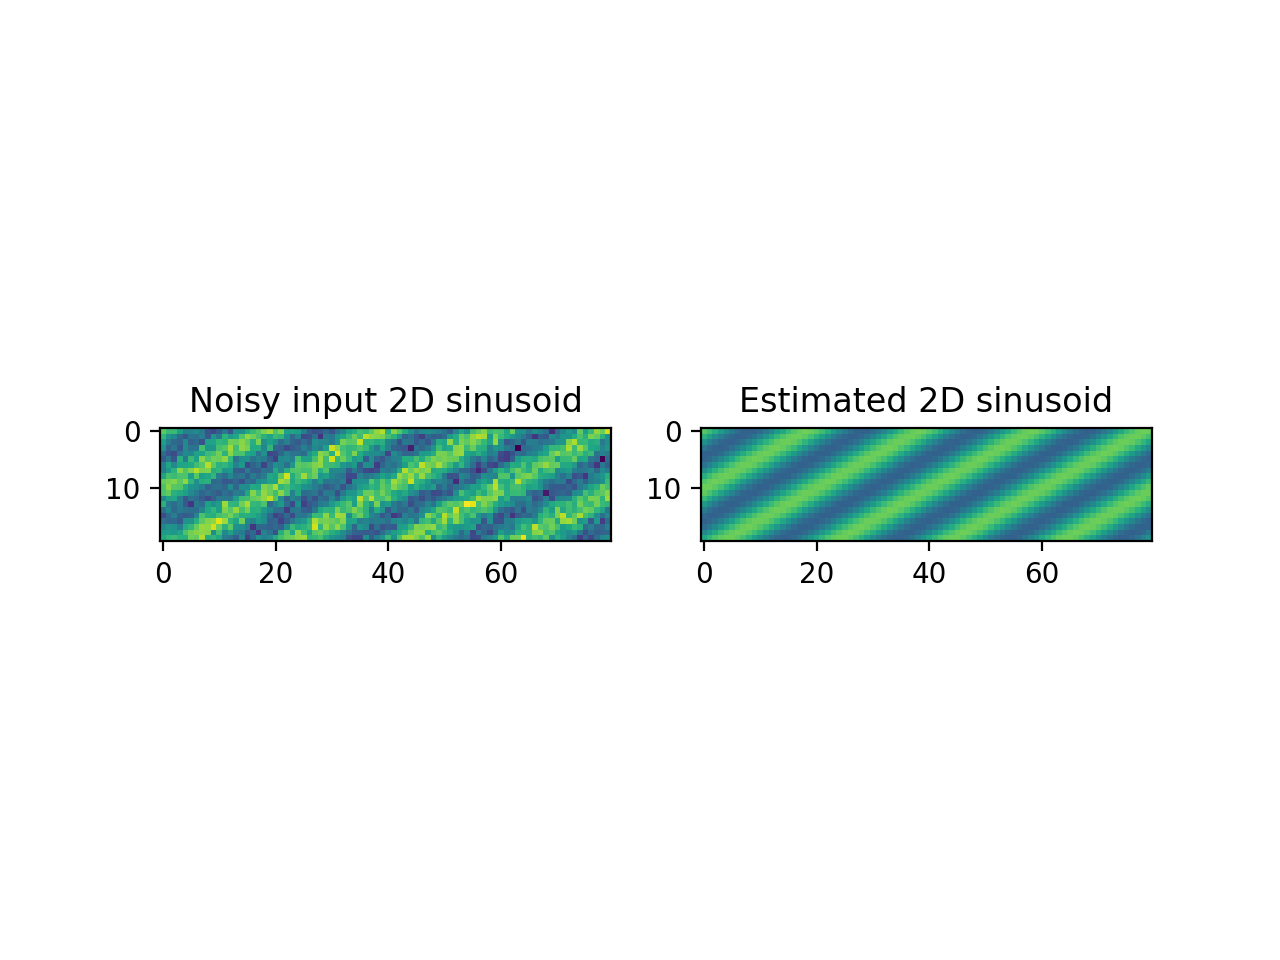
Estimate sinusoidal parameters and plot estimation
>>> A_hat, f_hat, phi_hat = sin2d_param_estimate(x, brute_Ns=100) # parameters estimation
>>> print(f'Estimated amplitude: {A_hat: .3f} (true value: {A: .3f})')
>>> print(f'Estimated frequencies: {f_hat[0]: .3f}, {f_hat[1]: .3f} (true values: {fn0: .3f}, {fm0: .3f})')
>>> print(f'Estimated phase: {phi_hat: .3f} (true values: {phi: .3f})')
>>> plt.subplot(121)
>>> plt.imshow(x, vmin=np.min(x), vmax=np.max(x))
>>> plt.title('Noisy input 2D sinusoid')
>>> plt.subplot(122)
>>> plt.imshow(A_hat * np.cos(2*np.pi*(f_hat[0]*n+f_hat[1]*m) + phi_hat), vmin=np.min(x), vmax=np.max(x))
>>> plt.title('Estimated 2D sinusoid')
>>> plt.show()
(
Source code,png,hires.png,pdf)